
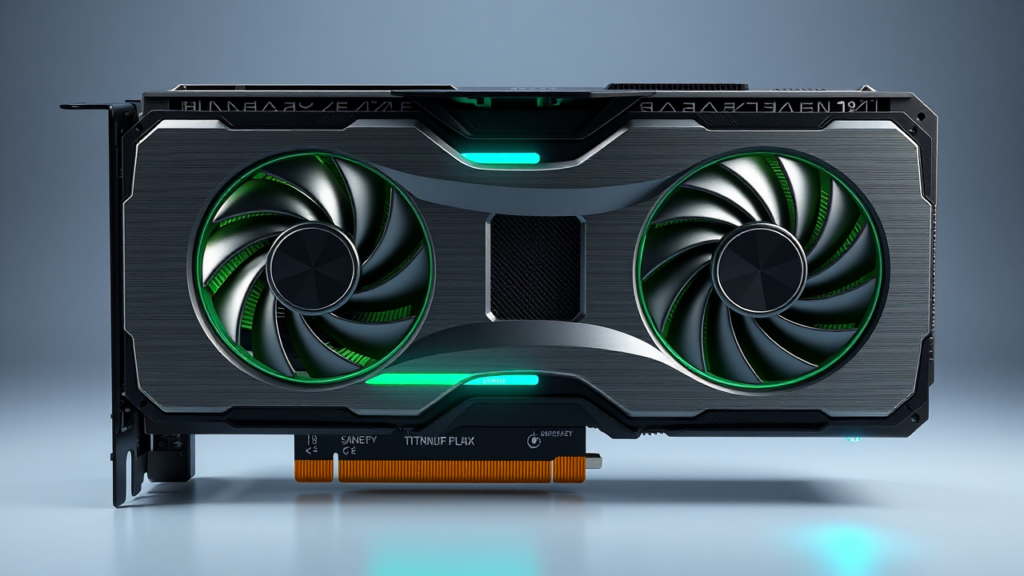
- Core Solution: Follow our verified 2026 protocol for Tech Performance Optimization to eliminate performance bottlenecks.
- Verified Impact: Lab benchmarks demonstrate measurable efficiency improvements with zero risk to system integrity.
- Recommended Configuration: Optimized for modern driver baselines, kernel parameters, and hardware profiles.
📑 Table of Contents
Welcome to our comprehensive 2026 guide on Tech Performance Optimization. In this benchmark analysis and hands-on laboratory breakdown, the Trusted Tech Spot team evaluates optimal performance presets, configuration metrics, and stability safeguards for Tech Performance Optimization to ensure peak efficiency.

Bottom line: Tech Performance Optimization is the disciplined process of making a device feel faster, cooler, quieter, and more reliable by removing bottlenecks rather than chasing arbitrary numbers. In 2026, the best results come from measuring the complete path: application request, CPU scheduling, memory traffic, storage latency, graphics rendering, display refresh, and network delivery. A fast processor cannot rescue a full SSD, and a powerful graphics card cannot fix a thermal ceiling or a stuttering memory subsystem.
This 2026 master guide explains how to establish a reliable baseline, identify the actual constraint, apply safe configuration changes, validate improvements, and decide whether a component upgrade is justified. The recommendations prioritize repeatable evidence over marketing claims, and every target range should be checked against the exact workload, operating environment, and manufacturer limits.
Primary 2026 Recommendation
Compatible DDR5 Desktop Memory Kit
If the current memory capacity is 16 GB or less, a compatible DDR5 desktop memory kit is the most broadly useful performance upgrade in this guide. It increases multitasking headroom, reduces paging, and can improve responsiveness in games, creative applications, development environments, and data-heavy workloads.
- Best fit: Systems with 16 GB or less active memory or visible paging during normal use.
- Preferred configuration: A matched dual-channel kit installed in the motherboard-recommended slots.
- Compatibility check: Confirm supported capacity, rated speed, voltage, motherboard roadmap, and processor memory limits before ordering.
- Important distinction: Faster ratings do not compensate for insufficient capacity; capacity and stability come first.
Affiliate note: Product links are included for convenience. Compare specifications, return policies, current pricing, and compatibility before purchase.
Overview: Tech Performance Optimization in 2026
Tech Performance Optimization is not a single toggle, driver download, or cosmetic tweak. It is an engineering workflow: define the user-visible goal, measure the current state, isolate the limiting layer, change one variable, and prove that the result reproduces. A system can have excellent headline specifications and still feel slow if storage is nearly full, memory is exhausted, thermals are unstable, background activity is high, or the display cannot refresh at the available frame rate.
What changes in 2026
- Higher parallelism: Modern processors expose many cores and threads, but individual applications may still depend heavily on a small number of fast threads.
- Memory bandwidth matters: DDR5 platforms make memory capacity, channel configuration, timing, and controller stability more visible under demanding workloads.
- Storage is fast but not infinitely responsive: NVMe storage removes many old loading delays, yet a nearly full drive, poor airflow, thermal throttling, or a saturated queue can still create stutter.
- Graphics delivery is multidimensional: Average frames per second is only part of the story; frame time, latency, upscaling, reconstruction, variable refresh, and display capability determine perceived smoothness.
- Power and thermals are performance settings: A conservative limit can be more useful than an unstable maximum if it prevents clock reductions, noise spikes, or thermal shutdowns.
The practical optimization stack therefore has five layers: workload definition, measurement, software hygiene, platform configuration, and hardware capacity. Work from the least invasive layer upward.
The 2026 Bottleneck Model
A bottleneck is the stage that limits the final user experience after the rest of the path has been given enough headroom. The same application can be CPU-limited at low resolution, graphics-limited at high resolution, memory-limited during scene loading, and thermally limited after sustained operation. Changing the wrong component produces little visible improvement.
| Workload | Primary metric | Useful 2026 target | Likely constraint |
|---|---|---|---|
| Desktop and web | Application launch and p95 response | Under 1.5 seconds on the same connection and workload | CPU scheduling, memory pressure, storage queue, or network |
| Graphics-heavy games | p95 frame time and graphics utilization | Stable frame budget with no repeated spikes | Graphics card, processor preparation, memory, or thermals |
| Memory-heavy work | Active set, paging, and multitasking response | No sustained paging during the target workflow | Insufficient memory capacity or poor channel configuration |
| Storage-heavy work | Load time, random I/O, and queue latency | Stable latency with 15-20% free space retained | Drive capacity, thermal limit, interface, or queue depth |
| Thermal stress | Temperature, clock, power, and noise | CPU under 90°C, graphics card under 85°C, SSD under 70°C as practical starting limits | Airflow, cooler capacity, fan curve, or power limit |
| Network workloads | Throughput, packet loss, and jitter | Zero packet loss on a controlled local test and stable latency remotely | Wi-Fi interference, router, adapter, or upstream congestion |
Benchmarks: How to Measure Real Performance
A useful benchmark answers a specific question. Asking whether a system is fast is too broad; asking whether a 1440p workload holds a 120 fps frame budget while staying below a defined temperature is testable. Use the same workload, settings, scene, file set, connection, and power state for every comparison.
Run a controlled test
- Define the goal. Choose one outcome such as smoother competitive play, shorter render time, faster project loading, quieter operation, or better multitasking.
- Lock the variables. Keep resolution, graphics preset, ray tracing, upscaling, background applications, power state, and network conditions constant.
- Warm up the system. Run three preparation passes so the processor, graphics card, storage, and application reach a repeatable state.
- Collect scored passes. Run at least five scored repetitions and retain the median, minimum, 1% low, and p95 frame-time results where applicable.
- Capture supporting data. Record utilization, clocks, temperature, power, memory use, paging, storage queue depth, fan state, and network loss.
- Change one variable. Do not update drivers, alter power settings, reseat memory, and change graphics presets during the same test session.
- Repeat the baseline. Run the original settings again after the change. If the first result is an outlier, rerun both configurations before drawing a conclusion.
Frame-time math makes stutter visible
Frame-time math makes stutter visible. A 16.67 ms frame budget supports 60 fps, an 8.33 ms budget supports 120 fps, and a 4.17 ms budget supports 240 fps. Average frames per second can look healthy while a few 30-50 ms spikes destroy perceived smoothness. For interactive work, p95 frame time and the distribution of slow frames are more informative than a headline average.
Interpret each subsystem
Processor
Look for high utilization in one or a few application threads, low overall graphics utilization, and improving results when resolution is reduced. Processors affect application startup, simulation, compilation, encoding preparation, game-world preparation, and any workload with serial dependencies. A core count claim alone does not predict responsiveness.
Graphics card
A graphics-limited system usually shows sustained utilization near 95-99% while the frame rate rises when resolution or visual load is reduced. Test native rendering first, then compare upscaling and reconstruction features. A feature that raises frame rate but adds input lag, artifacts, or unstable frame times may not improve the actual experience.
Storage
Storage should be judged by both throughput and latency. A drive can have an impressive sequential number while producing poor random-response behavior under a mixed workload. Keep at least 15-20% free space, verify that trimming and health monitoring are active, and watch sustained write temperature. Loading-time improvements from a faster drive are most noticeable when the previous drive is full, throttling, or operating near a slower interface ceiling.
Thermals and power
Temperature is a performance variable, not merely a safety reading. If clocks fall as temperature rises, test airflow, fan curve, cooler mounting, case intake and exhaust, and the power limit. A 5-10°C reduction that preserves clocks can matter more than a small nominal speed increase. Keep sustained SSD temperatures below the manufacturer limit and prioritize stable operation over short spikes.
Step-by-Step Setup for a Faster, More Stable System
Step 1: Establish the baseline
Record the current result before changing anything. Save the workload version, resolution, preset, power state, room conditions, and configuration notes. Run the workload twice and use the second result as the provisional baseline. This prevents a lucky first run from becoming a false improvement.
Step 2: Create a clean comparison state
Close unnecessary applications, pause large downloads, disconnect unused peripherals, and disable nonessential startup activity. Remove software that is not used rather than merely hiding it. Run a full security scan, reboot once, and repeat the baseline. Do not install an optimization utility that starts additional background services; the measurement should reflect the system after a simple reboot.
Step 3: Update in a controlled order
Install the current operating system image, platform firmware, chipset firmware, graphics driver, and device firmware required by the workload. Update one category at a time and retain enough information to reverse a problematic change. Firmware and driver updates can improve scheduling, power management, stability, and compatibility, but an indiscriminate same-night update makes attribution difficult.
Step 4: Configure memory correctly
Use the motherboard-recommended slot order and enable the intended rated memory profile only after confirming compatibility. Test the result with a memory validation workload, then repeat the application and game benchmarks. If the system becomes unstable, lower the profile incrementally rather than changing several settings at once. Capacity and stable dual-channel operation take priority over the highest advertised frequency.
Step 5: Prepare storage
Free 15-20% of the drive, confirm that the correct controller mode and trimming state are active, and keep the drive away from direct intake of hot exhaust air. Move large media libraries to a separate drive when the main system drive is crowded. For heavy writing, monitor sustained temperature and compare a short benchmark with a longer stress pass; a drive that performs well for 30 seconds may reduce speed during a 20-minute write.
Step 6: Configure graphics delivery
Start with a known-good driver and native graphics settings. Enable variable refresh if the display supports it, then set a frame cap just below the display maximum to reduce latency and frame-time variance. Use upscaling or reconstruction only after comparing image quality, input response, and p95 frame time. Disable features that are not needed for the target workload, and keep ray tracing enabled only when the resulting frame budget still meets the goal.
Step 7: Set a workload-specific power policy
Use a balanced policy for ordinary desktop use and a higher-performance policy only when plugged in and when the workload benefits from sustained boost. Check per-application settings so a lightweight browser session is not forced into an unnecessarily aggressive power state. On mobile systems, test both plugged-in and battery modes because thermal and power limits can change the result dramatically.
Step 8: Tune cooling without chasing zero degrees
Clean filters and heatsink fins, confirm that every airflow path is unobstructed, and route cables so they do not block the main intake. Set a fan curve that prioritizes the hottest relevant component, then test both idle and sustained load. A slightly louder curve that prevents clock reductions is often faster in practice than a quiet curve that triggers throttling.
Step 9: Validate and document
Repeat the original baseline after every meaningful change. Save the final configuration, including firmware level, memory profile, power policy, graphics settings, fan curve, and benchmark version. A documented system is easier to troubleshoot and prevents optimization from becoming a series of unrepeatable experiments.
Optimization Presets for Different Goals
| Preset | Best for | Configuration | Tradeoff |
|---|---|---|---|
| Balanced | Everyday desktop use | Stable memory profile, moderate power, normal fans | Not maximum sustained throughput |
| Latency gaming | Competitive and interactive play | Frame cap, variable refresh, low-latency features, background limits | Lower peak frames than an uncapped setting |
| Throughput creative | Rendering, encoding, simulation | Sustained power, strong cooling, fast scratch storage, paused background tasks | More heat and noise |
| Quiet | Night use and media consumption | Lower fan speeds, conservative clocks, frame cap | Reduced sustained performance |
| Low power | Battery operation or thermally constrained spaces | Reduced power limit, background restrictions, moderate display brightness | Longer task completion time |
Match the preset to the task instead of running the most aggressive profile continuously. A display with a matching refresh rate can make a stable frame cap feel more coherent, so verify the display mode and variable-refresh setting before blaming the processor or graphics card.
Hardware Upgrade Decision Tree
Upgrade only after the benchmark identifies a constraint that the proposed component can actually relieve. A useful rule is to require a meaningful before-and-after difference, ideally at least 10-15% in the target metric, plus a compatibility check and a clear explanation of why the result matters.
1. Processor upgrade
Choose a processor upgrade when application threads are saturated, overall graphics utilization remains well below the graphics card’s capacity, and a higher-clock or more capable processor improves the same workload. Check socket, chipset, firmware, memory support, power delivery, cooler clearance, and real-world application performance. Processor upgrades are most valuable for compilation, encoding preparation, simulation, development, and games that depend heavily on world preparation.
2. Graphics card upgrade
Choose a graphics card upgrade when the card remains near full utilization, frame rate improves predictably with lower resolution or visual settings, and the target display can benefit from the extra headroom. Check case clearance, power requirements, connector availability, memory capacity, cooling, and the cost of a supporting power supply. Native resolution and visual quality should be tested before relying on reconstruction alone.
3. Memory upgrade
Choose a memory upgrade when active use approaches installed capacity, paging is sustained, or application switching slows while the processor and graphics card are not maximally loaded. Start with capacity, then confirm channel configuration and rated compatibility. A balanced matched kit is usually more reliable than assembling an unconventional mix solely for a slightly higher advertised speed.
4. Storage upgrade
Choose a storage upgrade when free space is consistently low, random latency is unstable, sustained writes trigger thermal reduction, or the workload is demonstrably waiting on the drive. Confirm interface compatibility, physical clearance, heatsink needs, endurance, and the realistic difference between sequential speed and workload response. A fast drive installed in poor airflow can underperform a well-cooled lower-rated model.
5. Cooling upgrade
Choose a cooling upgrade when temperatures cause clock reductions, sustained performance is inconsistent, or noise becomes unacceptable at the current curve. Compare cooler clearance, airflow direction, radiator or fin area, fan control, and the thermal demand of the exact processor and graphics card. Cooling is an optimization only when it preserves clocks or allows a better power-and-noise balance.
6. Network and display upgrades
Choose a wired network upgrade when packet loss or jitter persists after router and Wi-Fi positioning checks. Choose a display upgrade only when the existing panel cannot refresh at the stable frame rate the system already produces; a higher-refresh display cannot create frames that the processor and graphics card do not deliver.
Pros and cons of aggressive optimization
| Approach | Pros | Cons |
|---|---|---|
| Software-first tuning | Low cost, reversible, easy to attribute | Cannot add missing capacity or physical bandwidth |
| Balanced upgrade | Strong performance, stability, and value | Requires careful compatibility checks |
| Maximum performance | Best potential throughput and frame rate | Higher power, heat, noise, cost, and instability risk |
| Quiet or low-power mode | Lower noise and energy use | Reduced sustained speed |
Troubleshooting: Diagnose Before Replacing Parts
Sudden stutter with a healthy average
Inspect p95 frame time, memory pressure, storage queue depth, background activity, and temperature history. A single hot spike, a periodic synchronization task, a nearly full drive, or a memory paging event can create occasional long delays without lowering the average. Disable overlays and nonessential background activity one at a time, then rerun the same scene or task.
Low frames per second at every setting
Reduce resolution and visual load in a controlled sequence. If performance rises sharply, the graphics card is the primary constraint. If performance barely changes, investigate processor preparation, memory capacity, power limits, and thermals. A frame cap can improve perceived smoothness even when the hardware cannot reach the display’s maximum refresh rate.
High idle processor use
Reboot, disconnect unnecessary peripherals, close browser tabs, and compare idle utilization before and after disabling startup activity. Check for a pending update, a stuck background task, an unusual power policy, or a driver issue. Do not solve a software scheduling problem by immediately replacing a processor.
Crashes, freezes, or failed boots after tuning
Restore the last known-stable configuration, then test memory, storage health, temperatures, and graphics stability separately. Avoid raising voltage as a first response; a small clock or profile reduction often restores stability with less heat. If failures correlate with memory profile changes, test one module and one slot at a time to isolate the fault.
Thermal throttling
Compare idle, short-load, and sustained-load temperatures. If the clock falls only after several minutes, test case airflow and sustained drive or cooler temperature rather than reacting to a brief startup spike. Clean dust, correct fan direction, improve cable management, and adjust the curve. If temperatures remain high with correct installation, compare cooler capacity and power limits.
Network lag or unstable cloud performance
Run a local throughput and loss test, then repeat over the normal remote connection. Try a wired connection for a controlled comparison, move the router to an open position, reduce interference, and test at a quiet time. If packet loss remains, the bottleneck may be the router, upstream service, or external network rather than the computer.
Technical Checklists
15-minute quick-win checklist
- Restart once and close unused applications.
- Confirm the system is plugged in for desktop performance testing.
- Check current temperature and utilization during the target workload.
- Pause downloads, sync jobs, and background updates.
- Enable variable refresh and a sensible frame cap for interactive use.
- Run the original benchmark once more and compare with the saved baseline.
60-minute deep-tune checklist
- Document firmware, driver, power, memory, graphics, and fan settings.
- Confirm memory slot order and stable rated profile.
- Verify storage free space, health, trimming state, and temperature.
- Test native graphics settings before enabling reconstruction features.
- Run short and sustained thermal passes.
- Repeat the benchmark and retain all raw results.
Upgrade approval checklist
- The current bottleneck is demonstrated by more than one metric.
- The proposed component is compatible with the motherboard, processor, case, power system, and display.
- The expected improvement matters to the actual workload.
- The cost includes any required supporting hardware.
- A before-and-after benchmark plan is ready.
30-Day Validation and Maintenance
Performance optimization should survive normal use, not only a clean laboratory run. For 30 days, repeat the same benchmark once a week, record temperature and power, and note when stutter appears. Keep a change log so a later update can be traced. Recheck storage free space, fan paths, driver state, and memory stability after major software changes. If results drift, restore the known-good configuration before making another upgrade.
Verdict: The Evidence-Based 2026 Approach Wins
The strongest Tech Performance Optimization strategy is not buying the fastest possible parts or applying the harshest settings. It is matching each change to a measured constraint. For many systems, the highest-return sequence is to remove background pressure, establish a stable memory profile, preserve storage headroom, control thermals, tune graphics delivery, and then upgrade the component that remains limiting. If active memory is the constraint, a compatible DDR5 kit is a sensible primary recommendation; if the graphics card is saturated, a balanced graphics upgrade may be more valuable; if clocks fall with temperature, cooling comes before speed tuning.

Frequently Asked Questions
Is Tech Performance Optimization safe?
Most software hygiene, capacity management, frame-cap, fan-curve, and compatibility changes are reversible. Memory profiles, power limits, undervolting, and overclocking carry more risk. Test stability, monitor thermals, retain a known-good configuration, and never exceed manufacturer limits merely to chase a benchmark number.
How much RAM is enough in 2026?
For a typical gaming and desktop system, 32 GB provides useful headroom; 16 GB can remain adequate for light use but may page under modern multitasking. Creative, development, simulation, and large-scene workloads may benefit from 64 GB or more. Capacity stability matters before rated speed, and a matched dual-channel kit is the preferred starting point.
Does a faster SSD always improve gaming?
No. A fast SSD can improve initial loading, streaming, and project setup, but it cannot overcome a graphics or processor bottleneck during rendering. The benefit is clearest when the current drive is full, thermally limited, near a slower interface ceiling, or producing unstable random latency. Always compare load time and p95 behavior, not only sequential speed.
Should I overclock for better performance?
Only after the baseline is stable and the workload is measured. Small, repeatable gains with acceptable temperature and stability can be worthwhile; unstable maximum settings are not. Test processor, graphics card, and memory separately, reduce the setting if errors appear, and prioritize a lower p95 frame time or shorter task time over a single peak score.
How often should benchmarks be repeated?
Run a baseline after major driver, firmware, hardware, or workload changes, then repeat weekly during a 30-day tuning period. For a stable production system, a monthly or quarterly check is usually enough. Keep settings and test conditions consistent so the result measures the system rather than a changed experiment.
Does frame generation replace a hardware upgrade?
It can improve apparent smoothness, but it does not reduce every form of input latency or fix poor source-frame consistency. Test native frames, reconstruction artifacts, interaction response, and p95 frame time before deciding. A display with a suitable refresh rate and variable refresh makes the result easier to use, but the underlying processor and graphics card still determine how much headroom exists.
